
Why does brand tracking have a one-size-fits-all approach?
Think about the last time you bought a car. Now think about the last time you grabbed a snack. One probably took weeks of weighing up, switching between endless open tabs, maybe a test drive. The other took about three seconds and no thought at all.
Two completely different decisions. But if you’re tracking brand health in either category, chances are you’re measuring both the same way. Awareness, consideration, preference, NPS, the same tidy funnel applied to everything. It’s the industry default, but that doesn’t make it right. And now there’s the data to prove it.
None of this is new thinking, to be clear. Ritson’s been banging the category-entry-points drum for years. Binet and Field showed the brand-building-to-activation balance shifts with the length of the purchase cycle. The idea that different categories need different treatment is well established in the theory.
What’s been missing is the hard proof at category level, the actual buyer data showing how much the differences bite, and where. That’s a tougher thing to produce. And, if we’re honest, it’s never really been in anyone’s commercial interest to go digging. A single framework, built once and sold a thousand times, is a much better business model than a bespoke build for every client.
At Basis, we’ve always thought that was the wrong way round. So we set out to prove it.
We asked 4,000 buyers how they actually decide
Across 18 categories, from alcoholic drinks to insurance, we asked people how they really make brand choices. Not how a framework assumes they do. What they actually do, step by step. And the gaps between categories were wider than we expected.
Take how a purchase even begins. In laundry, nearly seven in 10 buyers chose without comparing a single alternative. In broadband, that fell to 36%. Or take spontaneity: 51% of snacks are bought with no advance thought at all, against just 5% for cars. Same question, and the answers land worlds apart.
It keeps going. In fast food, 71% of buyers went with the first brand that came to mind. Pure salience, no deliberation. In tech, 74% chose the most trusted brand instead, leaning hard on reviews before they’d commit. And in online security, the driver isn't salience or even trust exactly, it’s fear: it’s the one category where a threat, not a want, starts the purchase. Three categories, three completely different engines. A tracker built for one is quietly the wrong tool for the others.
What does this mean for your tracker?
Here’s the uncomfortable bit. If your tracker runs the same framework on your category that it runs on everyone else’s, with maybe a bit of category tweaking, there’s a decent chance it’s measuring things that don’t matter to your buyers, and missing the things that do.
Loyalty’s the sharpest example. In spirits, most buyers say they always choose the same brand, and on paper that looks like rock-solid loyalty. Then you notice nearly half, 49%, would switch for something cheaper. Laundry posts an almost identical loyalty score, but only 22% would consider switching at all.
Same number on the dashboard. Completely different picture underneath. One’s genuine stickiness. The other’s a habit waiting to snap the moment a cheaper option shows up. A score that can’t tell those two apart isn’t measuring loyalty, it’s just a number you’re reporting upwards and hoping for the best.
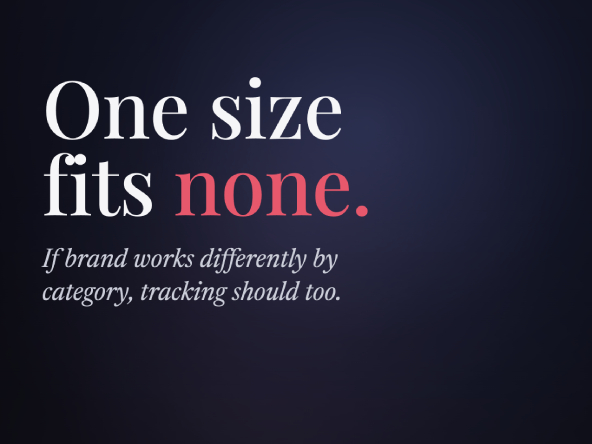
That’s the whole point, really. What drives the choice, what triggers it, what loyalty even means; it all shifts from one category to the next. So why would one tracker, built the same way for everyone, capture any of it? If brand works differently by category, tracking should too.
Because one size, it turns out, fits none.
Have a look for yourself
The full report covers all 18 categories, with the data behind every finding and what it changes for the metrics worth watching in yours. It’s free, it’s interactive, and there’s a PDF to keep. Pick your category when you download, and we’ll send its very own snapshot the day it lands.
If your tracker was built for everyone, it wasn’t built for you. This report’s a good place to see what you’re missing.
Explore the 2026 Brand Tracking Report →
Chris Hope is head of client strategy at Basis Global

We hope you enjoyed this article.
Research Live is published by MRS.
The Market Research Society (MRS) exists to promote and protect the research sector, showcasing how research delivers impact for businesses and government.
Members of MRS enjoy many benefits including tailoured policy guidance, discounts on training and conferences, and access to member-only content.
For example, there's an archive of winning case studies from over a decade of MRS Awards.
Find out more about the benefits of joining MRS here.