The more things change, the more they stay the same
There can be a tendency, particularly for those of us in the media industry, to see the past as a foreign country when compared to the challenges we face in an always-on, complex digital world. Surely, we say, things have never been more challenging compared to the relative simplicity of the past.
An innovative outdoor study from 1946, recently uncovered in the Route offices, serves as a fascinating time capsule showing that market demands and the desire to innovate are remarkably familiar features 78 years on.
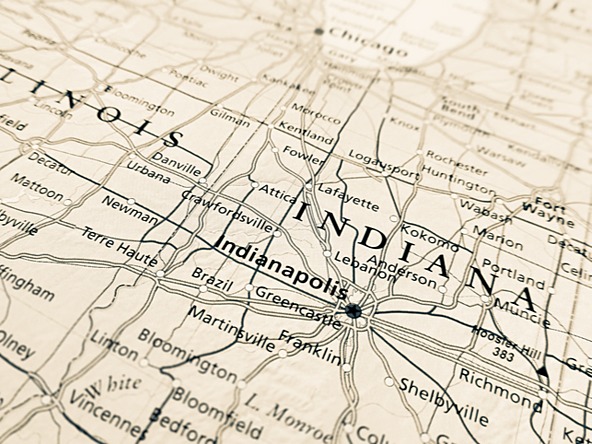
So let’s enter the Route Tardis for a trip to Indiana in 1946, a world not as different as we might expect.
The Fort Wayne Study is a leather-bound, hand-typed report on a pilot study conducted immediately after the second world war, successfully trialling innovative approaches to outdoor media measurement in the US city of Fort Wayne. Selected by the Traffic Audit Bureau as being a ‘typical’ American city, $50k was invested in the project, equating to an impressive $750k today.
The survey piloted three interlocked approaches: an in-home travel survey, traffic counts which recorded licence plates and a poster recall study.
What has changed and what has stayed the same?
The report reflects the challenges of audience measurement in a world before Excel and broadband, a world in which paper punch cards recorded the data and ‘transparent overlays’ (acetates) are seen as state-of-the art technology. Our world may be complex, but we take our IT tools for granted. In the analogue research era, processing and analysing complex data was a manual, painstaking task.
In 1940s lingo, outdoor media owners were referred to as ‘plant operators’ and an advertiser’s drive around to check their sites was ‘riding the plant’. The world of outdoor measurement still took its lead from the dominant medium of the time, using print terms such as ‘circulation’ and ‘readership’.
Nonetheless, what shines through this glimpse into the early days of outdoor measurement is how common many of the objectives were, compared with today. This was a pilot for a new way of doing things, driven by an advertiser consultation that reflected a desire to optimise their media spend, to move beyond simple traffic counts and have more granular estimates of reach and frequency to guide media planning. Sound familiar?
To calculate reach and frequency, observers recorded car licence plates so their exposures could be deduplicated. The licence plates served a similar role to that played by cookies!
The Fort Wayne survey structure pointed the way forward for outdoor measurement like Route. We’d now label it ‘hybrid’, combining as it does claimed behaviour, observed traffic, direction of travel, site visibility classification of the 333 sites around Fort Wayne, and finally, poster campaign recall.
There was already a realisation that passing a site does not necessarily mean it is seen and the study derived a calculation of ‘effective circulation’, factoring in size, position and type of travel; for example, those on ‘public transportation’ were seen as having a 25% chance of viewing compared to 50% in ‘automobiles’.
The report also shares an early example of combining sample-based data with big data. Until then, passenger counts had been derived from ticket stamps, but the invention of a fiendish idea called a ‘bus pass’ (it’ll never catch on!) meant that there was no data on how many journeys pass users made, so information from observers on a sample of buses was fused with bus company census data.
The research reflected a desire to move beyond exposure to measure impact. In this case, the metric measured is endearingly called ‘remembrance’, which we would now probably now categorise as engagement.
However, even in 1946, there was an acknowledgement that ‘remembrance’ does not equate directly with sales. You guessed it, the priority for the buy-side was outcomes. As the report puts it: “The ultimate measure of the effectiveness of most advertising is the sales attributable to the advertising, but such evidence is difficult to obtain.” Nowadays, we have access to granular sales and first-party data, but that holy grail still remains.
Clarity and transparency endure
Two broad themes echo across the decades: the need for clear terminology and for transparency.
1. Clarity
The report devotes a section to the calculation of coverage but admits that:“Coverage, as used in the outdoor medium is a term which as a general concept well understood, but for which there has been no precise definition.” The report identifies a need for the metric to be “defined more explicitly and to be spelled out in measurable terms”.
In 2024, we are still facing a crisis of definitions and language, in which the use of words like impressions, engagement and outcomes can reflect the user’s – rather than a common – interpretation.
2. Transparency
It’s striking the efforts the report takes to explain exactly what the tests involved and what the strengths and limitations were; no small feat given the complexity of the methodologies used, but the report is determined that the reader should understand every element of the project.
Transparency is essential to building trust and, as our measurement approaches get ever more complex, we too should resist the temptation to retreat into a ‘black box’ or need-to-know mindset.
The Fort Wayne study came at a pivotal point in history as the US gradually returned to normality after the war and reflected a desire for the outdoor industry to innovate for a new era. That chimes with the situation we at Route found ourselves in during and post the recent pandemic. We took the inability to conduct research during lockdowns as an opportunity to reflect on and improve the methodology, ready to track our return to a new normal. So, I will leave you with ten ‘factoids’ about the ‘new normal for the citizens of Fort Wayne in 1946.
Fort Wayne facts
- An average of 76% of people left their homes each day.
- 85% of males went outside each day but only 69% of females ventured out. Women made up a quarter of the workforce.
- Fort Wayne was a city dominated by the car, even in 1946. 65% of trips were by automobile, 25% by mass transportation and 8% by foot.
- Across the six years of the war, it appears that the number of journeys each day had increased by 38% and the number of mass transportation journeys by 150%. The report does not speculate as to why, given that the population was fairly stable.
- The survey reports that actual impressions would be increased by 16% if all sites were illuminated at night.
- Of the specific advertisers surveyed, the largest campaigns were for Ford trucks, followed by Berghoff beer.
- The most remembered campaign among men was for Standard Oil, and for women it was the packaged, sliced, white bread brand Holsum.
- The report attempts to answer the question of how many days a campaign needs to achieve ‘maximum remembrance’. The answer is 43 days, but this figure is “tentative and in need of much further study”.
- In the ‘remembrance’ study, a poster not shown in the region for M&Ms candy was included as a test control. 5% claimed to have seen it and researchers had to admit that this was technically possible as some returning soldiers might have seen it in Europe during the war.
- Throughout the report, the term ‘per cent’ is used, reminding us of what a percentage is: per hundred.
We hope you enjoyed this article.
Research Live is published by MRS.
The Market Research Society (MRS) exists to promote and protect the research sector, showcasing how research delivers impact for businesses and government.
Members of MRS enjoy many benefits including tailoured policy guidance, discounts on training and conferences, and access to member-only content.
For example, there's an archive of winning case studies from over a decade of MRS Awards.
Find out more about the benefits of joining MRS here.


0 Comments