
Picture this
In the era of big data, a simple line graph or pie chart is often not enough to capture and communicate the story behind the numbers. Data visualisation has evolved into a type of functional art form, capable of conveying complex information in a simple, intuitive way. As data journalist and Information is Beautiful author David McCandless says: “By visualising information, we turn it into a landscape that you can explore with your eyes: a sort of information map. And when you’re lost in information, an information map is kind of useful.”
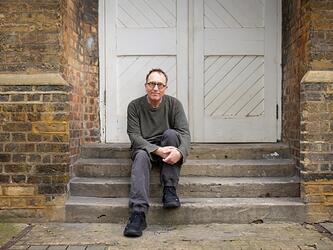
We talked to Carlo Zapponi, data visualisation specialist at Microsoft, about what you need to put yourself on that map.
How did you first get into data visualisation?
I did a Masters in Computer Science and worked in my own tiny company with friends for five or six years. Then I started to be more interested in the field of user experience, user research and user-centred research. So I did another Masters in Interaction Design and got more into that field.
After that I worked as a senior design technologist, which is a position similar to an engineer, but an engineer that works with designers, giving input during the design phase. It bridges the gap.
There I started to work on data visualisation; at first because we had a client where we had to do many charts, and then I started to research data visualisation on my own and it became my focus.
Can you remember your first project?
It was in November 2010 and it was a real-time visualisation of tweets; in fact it was the first one in the world. You could see in real time where tweets were happening, and it went viral on the web. It was quite exciting, and from there I started to do more and more projects, both at work and during my free time.
Tell us about your current job.
Now I sit in the consumer intelligence team at Microsoft, and we receive a lot of data coming from consumers, in different forms: through surveys; data coming directly from phones; social networks; interactions in stores.
I take this data and try to build easy-to-understand visualisations. We have different ways of presenting the data: dashboards that are used inside the company; more traditional power point reports; and my stuff, which is web-based. One of the things I always try to put in all my projects is a playful layer, so the user can play with it, explore, and be engaged with the data. I really believe it’s very important that we as users want to explore, but also to play a bit and feel more engaged when we explore the data.
What does a typical day look like for you?
There isn’t really a typical day, because I cover the whole process: from the concept phase to the delivery of the project. Working in data visualisation is still not as evolved as software development, even though it’s very similar. What we do is the same, but you will rarely find big teams of designers, developers, testers, all working together on different parts of the process. You’ll find more one-man-bands: they do the research, the analysis, they work with the data, they start to have first ideas, then prototype… they do the whole thing. So that’s what I do, I cover the whole process, and my day depends on the stage I’m at in the process.
At the beginning I study the data. I usually use traditional tools – even Excel is fine, or Tableau, which I put all the data into, and start to observe what’s happening, using traditional charts like bar charts. After that, I start to sketch on paper what can be visualised, and how. Then I start to prototype. And it’s a cycle so it goes back: sketch-prototype-sketch and so on.
What skills do you need to do your job?
I have a background in computer science – I know the tools, so I code my own visualisations. But there are other data visualisation designers who are more into the visual aspect, so they use more visual tools and less coding. Some don’t do any coding at all.
Right now there are many tools that make it possible to create quite neat visualisations, so if your goal is just data analysis and you don’t need amazing and appealing and engaging work, you can rely only on these tools. In that case the main skillset is some background in statistics.
But for what I do, the three vital skills are: programming for the web; some visual design or interaction design skills and a bit of statistics, just to understand the basic things. These three skills go very well together.
Nowadays a lot of people call themselves information designers, but really they’re just creating words and pictures. What do you think of that?
Now that data visualisation is a buzzword, many visual agencies are jumping onto the bandwagon. But I remember the beginning of the web – everybody was able to make websites, and you would see a lot of ugly stuff about. Now they are slowly going away – it’s like a sort of selection.
Right now I believe there is a lot of data visualisation that is not well done, and usually this stuff is some sort of long infographic with big words, big numbers, some pie charts. But I believe slowly they will disappear. I don’t know how fast, probably slowly, but they will disappear.
Do you think data visualisation is making data more accessible?
Yeah, I think so. I really like to think that we could add some sort of chart or visualisation to every article in every newspaper. You would just see it and you would understand the article – it would be so helpful.
Another thing that’s really bothering me is politicians talking on TV who are just throwing numbers around. What if you could see, in real time, the charts with the official data related to whatever they’re talking about? Then you could understand in that moment if the politician is lying or if the data is correct. I believe people will ask more and more for this, and if the work is well done, they will also understand it and appreciate it.
Finally, Carlo, what advice would you give to someone looking to get into data visualisation?
To look at things in a different way. Always question yourself – is that the best way to present something? Or is there some other way you can do it? That triggers your curiosity to check the data, check the story and think if there’s another way to present it. Always question.
Examples of Carlo’s work can be found at www.makinguse.com
Originally published in Impact Issue 6, July 2014. Click here for more information, or to subscribe.
We hope you enjoyed this article.
Research Live is published by MRS.
The Market Research Society (MRS) exists to promote and protect the research sector, showcasing how research delivers impact for businesses and government.
Members of MRS enjoy many benefits including tailoured policy guidance, discounts on training and conferences, and access to member-only content.
For example, there's an archive of winning case studies from over a decade of MRS Awards.
Find out more about the benefits of joining MRS here.


0 Comments