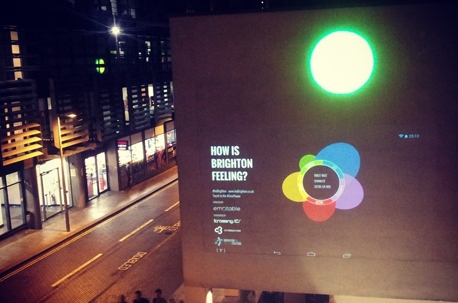
As part of the Brighton Digital Festival in September this year, we used Emotable to analyse more than 400,000 Tweets linked to the city – either via a mention of Brighton, commonly used hashtags or Twitter handles that we knew to be people in the city. Emotable then tagged the emotional content of each Tweet and classified it in real-time.
Almost 70% of all tweets with emotional content were happy. That baseline is significantly higher than other topics we have looked at with the Emotable engine. The full emotional profile of Brighton that we constructed also included 13% sad, 9% surprised or excited, 8% scared and 7% angry tweets (note that the total of these is more than 100% because some tweets contain multiple emotions). No other emotion comes anywhere near ‘happy’.
Interestingly, Brighton also tends to be much more emotional in the late afternoon and evening, with most of the emotional posts coming between 3pm and midnight.
Dr Peter Passaro, chief data scientist at Datanauts picked out some of the highlights: “The emotional language we captured became even more powerful when context of the topic was overlaid. For example, over the past few months, there has been a lot of very heated political language between Brighton residents and Hove residents over the building of a controversial new lookout tower called the i360. It can get pretty ugly on social media.”
So what were we trying to achieve? We designed the ‘Mind of a City’ project to use social media as a real-time mood barometer of the city. We wanted to imagine the city as a collective being. How does a city feel at any given moment?
While social media only provides a sample of city sentiment, the volumes of information represent the largest open data source that we could tap into to understand a collective expression of feelings. What’s more, people tend to wear their hearts on their sleeve on social media, giving a more candid opinion of their experiences.
Challenges we had to overcome
As with any analysis of large data sets, cleaning the data up and getting rid of noise is always the biggest challenge. When we set the filters to capture the data, we had to exclude any irrelevant mentions of ‘other things’ called Brighton. Ultimately social media data is only as good as the filters you can construct to cut out unwanted noise. Our tagging of ‘city identifiers’ were effective – as were the emotional processors. Although it took time, it was worth it for an accurate reading as we estimate the tweets to be 98% related to Brighton, UK.
However a big question thrown up from our analysis of the Twitter data is how to treat popular retweets? Should these amplify the emotions expressed or should they be excluded as they can potentially skew the emotional data? At what point does a retweet that links to the city no longer reflect the mood of the city – but rather nothing more than a celebrity comment?
Data volatility
While the technology proved robust, the data itself was more volatile than expected – the flow of tweets was not as consistent as we thought it might be. The team experienced peaks of activity around 4pm and 9pm on weekdays with intermittent quieter periods – particularly during the mornings. Sunday also tended to be a very quiet.
This had a big impact on the way we presented the results. Our aim was to share the data with the public to really get people engaged in the mood of their city. We projected the results onto the side of a building in the centre of Brighton in a giant visualisation dubbed the EmoFlower.
We wanted the data visualisation to be as close to real-time as possible so we started out with a 10 second window for the data but ultimately settled on a 30 minute window.
This project was part of a wider initiative called ‘Imagine Brighton’ which uses open data sources including transport, health, crime, education, the environment and local economy, to help improve the city. But there are obvious opportunities for brands to use this kind of data capture too.
The analysis need not be limited to social media but can be applied to any information source including customer service, market research and crisis management – all of which captures real experiences and emotions expressed about a brand. Brands can build emotional context into marketing campaigns and measure the results in new ways. In the digital world this can lead to tailoring messaging to specific groups of customers, helping brands to build lasting, more meaningful relationships and create moments that really resonate with their target audience.
Sam Zindel is director of research and insight at iCrossing.


0 Comments