
OPINION11 June 2015

Thresholds have been in the news recently. Not the ones we carry our new spouses over, but specific levels we refer to in the things we measure.
The reason the spotlight has been on them is that apparently a lot of the thresholds we use to determine our own health-related behaviours are set with no good reason. For instance, the BMI classifications we use to define people as “normal”, “overweight” and “obese”, are, (and I’m quoting the report in which these were originally set), completely arbitrary. The threshold of 25 for “overweight” has no specific relationship with any health outcome. None at all.
The same is true for cholesterol levels, where the target level of 5 is rounded down from 5.2, which was the lower limit of a normal range identified as between 5.2 and 6.2. This time the threshold was not set arbitrarily – the doctors who were doing the research needed to get hold of a sample of people with “high cholesterol”, and setting a definition of high as above 6.2 wouldn’t have given them enough people. So 5.2 was chosen as the target level. Then, over time, people being people with their need to simplify things, the threshold figure was rounded down to 5.0.
Likewise there are no sound reasons for weekly recommended guidelines for units of alcohol consumption (almost completely fictional), and suggested portions of fruit and vegetables a day (in Japan it’s 7+, and in France it’s 10+. No-one really believed the Brits would eat that many – so a more realistic threshold was set).
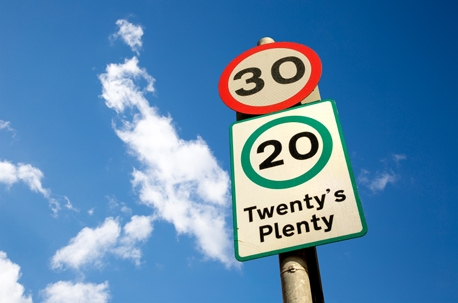
The need for speed (limits)
Most of us will be disturbed at the revelation that these health-related thresholds are essentially made up. The health-conscious among us use up some serious headspace trying to ensure we stay above, below or on a par with, these various targets, and their lack of validity is frustrating to say the least. For other thresholds though, we must already know that they are set pragmatically rather than on the basis of their impact on something else.
Speed limits are a good example of these. We would all probably expect that nothing serious happens to the incidence of car accidents if we go from 30 to 31 mph, or 40 to 41mph, but we also know that we have to have speed limits, so we might as well set them using round figures that people can remember. In fact, a lot of thresholds in our lives are determined by our use of a denary number system – birthdays ending in a 0 are considered “big ones”, whereas many will attest that mid-life crises can strike any year after the age of 32. (If we used a binary system your 11111 birthday might be considered a big one – but you would actually be celebrating your 31st).
Out of the box
With all this in mind, what do we think of the thresholds we set constantly in research? The most pervasive is the Top 2 Box Agree score. Have you ever wondered why this is the industry’s threshold (and metric) of choice? How do we know that agreeing rather than agreeing slightly is the step change required to really drive (for example) customer retention or brand choice? Unless we have explored the data in relation to the outcomes that drive business success, then very clearly, we do not. And very few researchers EVER do this – EVER! (Be honest, when was the last time you compared % Top 3 vs % Top 2 vs % Top 1 against intention to switch, or purchase intention, to see if there was a threshold effect?)
Another really pervasive threshold is set within the Net Promoter Score (well, two thresholds to be precise). Take the % of people saying 9 or 10 on a recommendation scale, subtract the % that say 0 to 6, and hey presto, two thresholds come together in semi-mystical glory to make the holy grail of customer retention. I don’t know enough about it to doubt the veracity of the analysis that went into the setting of these thresholds, but when I have looked at our own primary data, (albeit only set against self-reported measures of retention likelihood), they don’t hold water. The relationships between such variables are essentially (and rather mundanely) linear. Improve service bit by bit, and intention to stay or recommend increases bit by bit. There is generally an absence of support for a threshold that must be reached to really start changing consumer behaviour.
Threshold validation
I know why we use thresholds. I get that reporting %s rather than mean scores is a more accessible way for non-statisticians to understand what’s going on in their data. I know that they make the task of communication easier. I also know that thresholds help create targets and that these can drive business actions. So thresholds do a lot of good. But let’s base them on something solid – ideally an understanding of which levels are necessary to create shifts in the behaviour that drive business success.
I don’t think we need to do a “threshold validation” analysis with every dataset we get from every piece of research we conduct. But to do them sometimes, in the categories we are working in and against the outcomes that are most strongly related to business success, is essential.
Leigh Morris is managing director of Bonamy Finch

The world's leading job site for research and insight
Resources Group
Quant / Qual Research Manager – Global Communications Agency
circa early / mid £40\'s + Bens
Resources Group
Research Manager – Public Policy / Social Research
£37,000–£41,000
Resources Group
Evaluation Lead – Energy and Environment
£Excellent + Benefits
Related Articles
-
Brought to you by:

©2024 The Market Research Society,
15 Northburgh Street, London EC1V 0JR
Tel: +44 (0)20 7490 4911
info@mrs.org.uk -
© Copyright 2024 Research Live
0 Comments