
FEATURE11 January 2012

Designers and journalists are coming up with some striking ways to tell stories and convey data visually. But a new book suggests there is something missing from the field that researchers could provide.

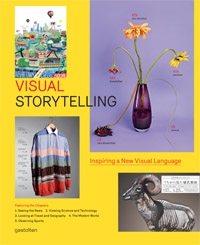
By Carl Kleiner. From Visual Storytelling, copyright Gestalten 2011
Everybody wants to have a go at data visualisation these days. Including market researchers.
But the ability of research people to present data visually is questionable. A showcase at last year’s Research conference included some great pieces of information design and some much less impressive ones.
Researchers seeking inspiration for how to present findings will find plenty in Visual Storytelling, a new book from art and design publisher Gestalten, which gathers some stunning visualisations and other examples of stories told visually – including maps, sculpture, photography, diagrams and posters.
The examples fall at various points on a scale from data-heavy to purely decorative: in some cases the visuals convey concrete information, at others they just bring emotional context to some kind of narrative. There are also interviews with some of the people behind them, discussing the ideas and processes that go into their work, including Peter Grundy, whose infographics have appeared in The Guardian and The Telegraph, and Steve Duenes of The New York Times.
Sarah Illenberger’s illustrations of survey results (about politics, sexual health and life satisfaction) for German magazine Neon are particularly striking, and should be studied by any researcher looking for fresh ways to present quantitative data.
Other highlights include the work of Carl Kleiner, whose photos for an Ikea cookbook depict the full ingredients of each recipe, laid out in geometric patterns (pictured above is what goes into Swedish ginger biscuits). Some of the work is essentially glorified pie and bar charts – like Peter Ørntoft’s visualisations of Danish social statistics (below) and German media agency KircherBurkhardt’s charts presenting economic data using the colours of the country’s flag.

By Peter Ørntoft. From Visual Storytelling, copyright Gestalten 2011
In the book’s introduction journalist Andrew Losowsky criticises a recent glut of “relatively meaningless” visualisations, saying that the best examples are “inspiring, fascinating, visually interesting and easy to read, while conveying complex levels of information in an impactful way”.
But getting the right balance between style and substance is easier said than done. Losowsky’s assertion that “the visuals have to serve the data as well as the audience” is followed by plenty of examples of the visuals failing to serve the data. This is not always the fault of the people who produced the visualisations – it’s more the way they have been presented in the book. Some are printed purely for illustrative purposes, too small to do them justice, inadequately labelled or in foreign languages without translation.
Visual Storytelling is a beautiful and fascinating book but, given its title, it shows a surprising unwillingness to let the visuals tell the story. It ends up reinforcing the view that the main purpose of infographics is to look nice and impress people.
Perhaps that’s not surprising in a publication aimed at a design audience. And it’s worth noting that there are no contributions here from research agencies, even though much of the data that goes into infographics is from surveys.
If Visual Storytelling has something to teach research professionals it’s that there’s a huge opportunity to bring some rigour to a field where substance is often eclipsed by style. Part of the appeal of infographics from a designer’s point of view is the feeling of working on something weighty, important and based in fact. It’s up to people with a good understanding of data, how to process it and how to present it, to make sure that this is more than just a feeling.
Visual Storytelling: Inspiring a New Visual Language is published by Gestalten at $65

The world's leading job site for research and insight
Resources Group
Research Manager – Education Research – Leading Social Research Agency
£35,000–£47,000 + strong benefits
Spalding Goobey Associates
Research Manager – Quantitative Research – High Quality Insights Consultancy
£42,000 to £52,000 + Benefits
Resources Group
Associate Research Director – Focus on Ad hoc studies! – Innovative Insight Consultancy
£45,000–£55,000 + great benefits
-
Brought to you by:

©2024 The Market Research Society,
15 Northburgh Street, London EC1V 0JR
Tel: +44 (0)20 7490 4911
info@mrs.org.uk -
© Copyright 2024 Research Live
3 Comments
Lucy Davison
12 years ago
Thanks for generating attention in this book, and interesting that, yet again, in a book about the presentation of data, researchers are missing! Although I do not agree with your criticism of Peter Orntoft's 'glorified pie chart' shown here. I think this works well on several levels; it's visually striking and it draws attention to an issue very simply and effectively. There's a reason why some chart designs have been used a lot - there is nothing inherently wrong with a pie (although I prefer mine with custard of course!).
Like Reply Report
Phil Durand
12 years ago
I liked this very much right up to the point where the learning for researchers seemed to be twisted into a learning for the graphical designers instead - i.e. involve the researchers more and your graphics will become better (hope I understood this properly). While I think there is some truth in this, I also feel that the creation of a good info-graphic is about editing. What you leave out is just as important as what stays in. I'd say that many researchers are not trained editors. This means we can try to put too much into a graphic, capturing all the caveats and being technically accurate, but at the same time masking the central message behind too much detail. Certainly a book I'll take a look at.
Like Reply Report
Edward04
12 years ago
Infographics are an area where MR has much to catch up on in terms of just getting on an using them, IMHO - what % of data presented is visualised at all in presentations? what % visualised innovatively (ie beyond powerpoint standard stuff) Not as much as could be, I would suspect. I'm not sure what the article's trying to get across - but it sounds to me like it's equivocal in tone, ie yeah, infographics are great, but they're difficult to do and MR is by evidence lousy at them. I say a) if it looks great, then hey you've got the audience attention - don't forget Rule Nr. 10 of 2008 "Brain Rules" (Medina) "Visuals trump all other senses" and Rule Nr. 4 "We do not pay attention to boring things" ( thanks to @nielsamz for this reference in the Green Book blog). Never subsitute style for substance, but don't go overboard on substance overload - encourage folk to get to the detail once you have their attention. Infographics are cool, and if we're too sniffy about them, too librarian like, then hey presto, we cement our image as the backroom boys.
Like Reply Report